I was in Vienna beginning of July and took some time to check Vienna Biennale. Part of the biennale took place in to the architecture museum where I had the pleasure to discover some old data visualization work from the Austro-Hungarian empire by Anton Leo Hickmann.

Unlike some other past masters of the art, he didn't seem to be widely known.
I managed to find some information about him in German and took the opportunity to create the wikipedia entry but it is minimal. You can check it here and improve it if you have any additional knowledge. You can find one reproduction/compilation of his books on Amazon. It seems to include Wien Im XIX Jahrhundert from which some of the pictures I took where extracted as far as I know. Other pictures are from the book Geographisch-statistischer Taschen-Atlas von Österreich-Ungarn, and you can find some info on Google books
I hope you enjoy the pictures below (sorry for the quality) along with the descriptions I attempted (I am not fluent in German). Please notice me of any error I may have made.
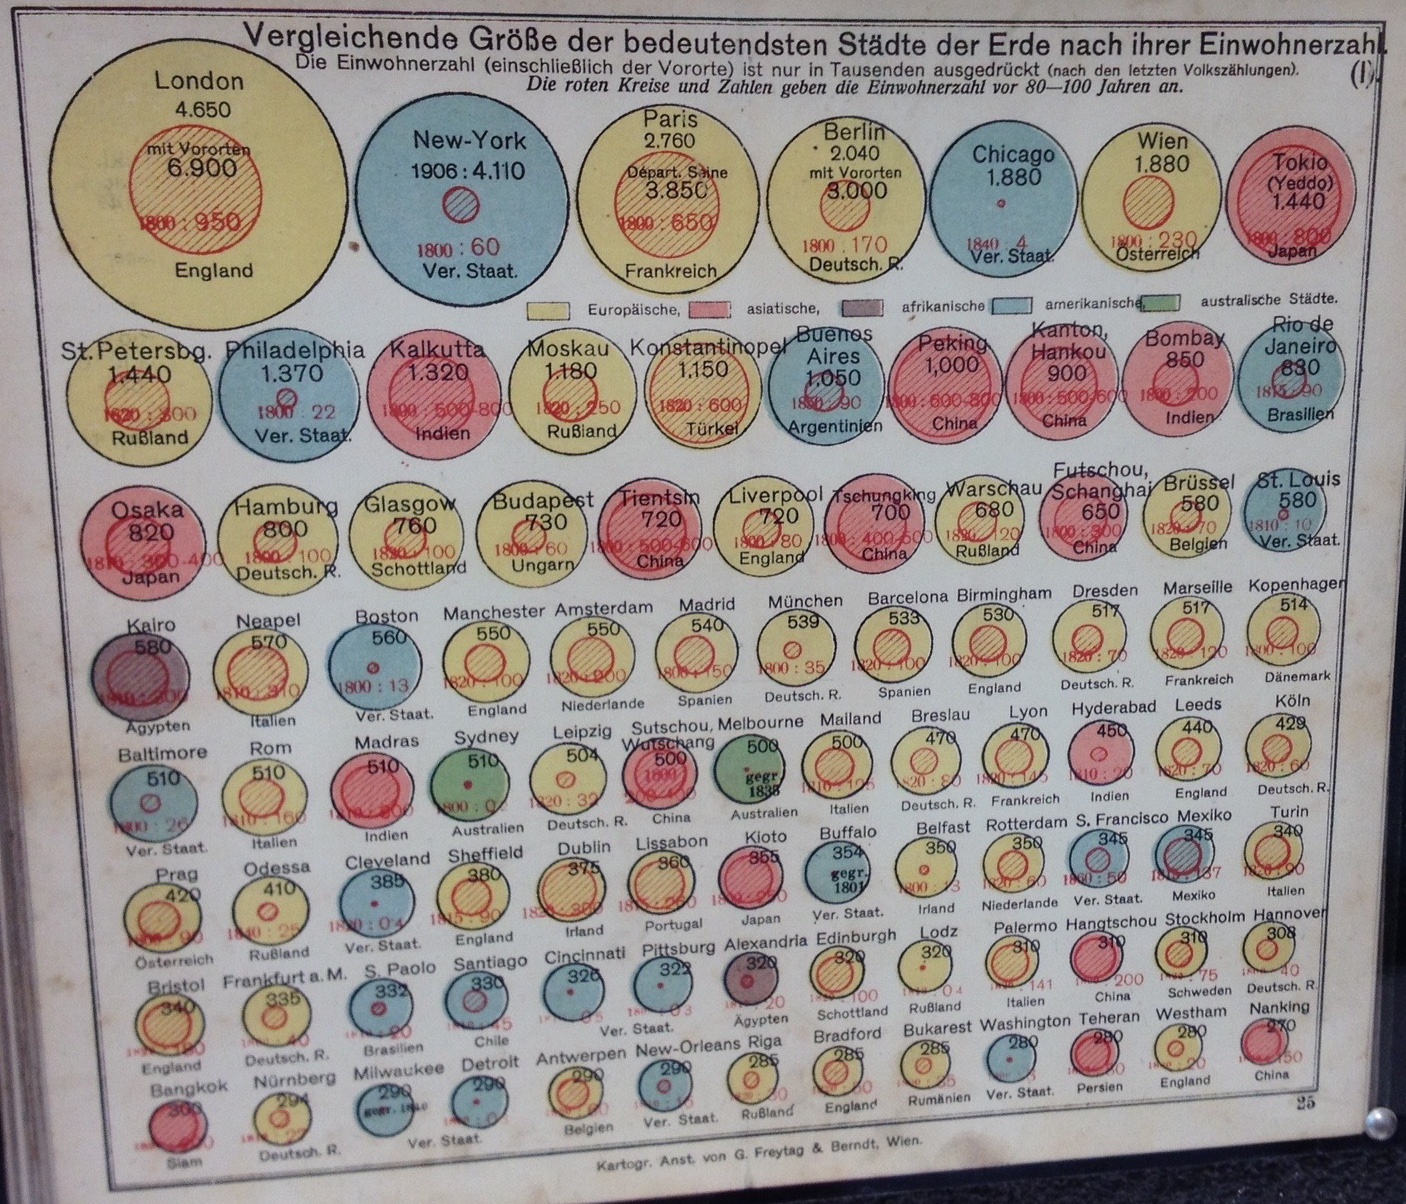
Populations in cities of the world
This visualization (above) describes the population of the biggest cities in the world in 1900 and the evolution since 1800 (or around depending on the data he could get) using concentric circles. The encoding, using area of circles representing population, while correct, can be difficult to understand accurately at a glance as we sometime focus on diameter instead. Colors represent the different continents
It is interesting to see how American cities population exploded and most European capitals at least quadrupled during those years, Asian cities like Tokyo or Beijing had much more limited growth (due to later industrialization?). Europen population does appear dominant at this time.
Populations in cities of the Austro Hungarian empire

In this description of cities of the Austro-Hungarian empire in 1900, one can compare the sizes, main language and distribution of practiced religions. Colors represent the affiliation to each part of the empire.
Austria is obviously dominant over Hungary within the empire in term of population.
While there is some decent amount of german speakers in Budapest and Prague at this time, there is almost no Magyar (Hungarian) speakers in the other capitals.
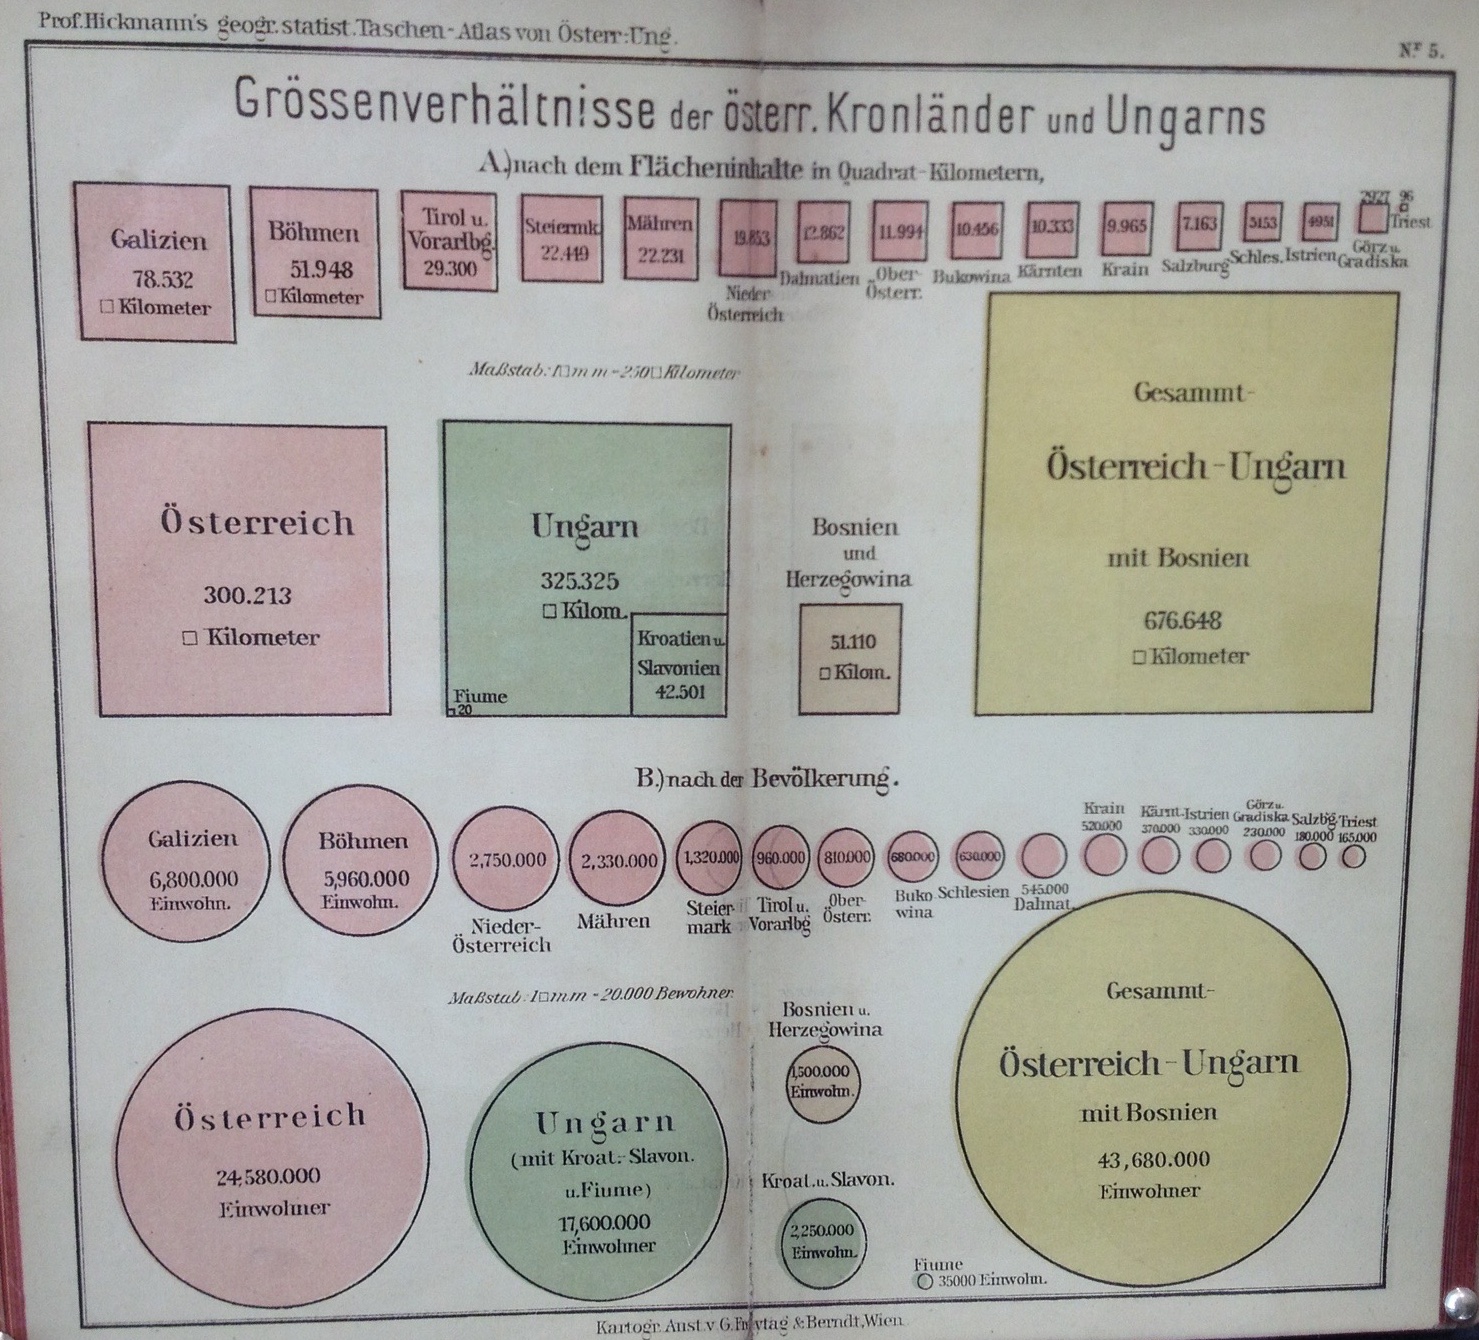
Population and area of cities in the Austro-Hungarian empire

In this visualization, Hickmann choses to continue using circles to represent populations while using squares for surface area.
The spatial organization of the elements shows a strong correlation between the 2 metrics.
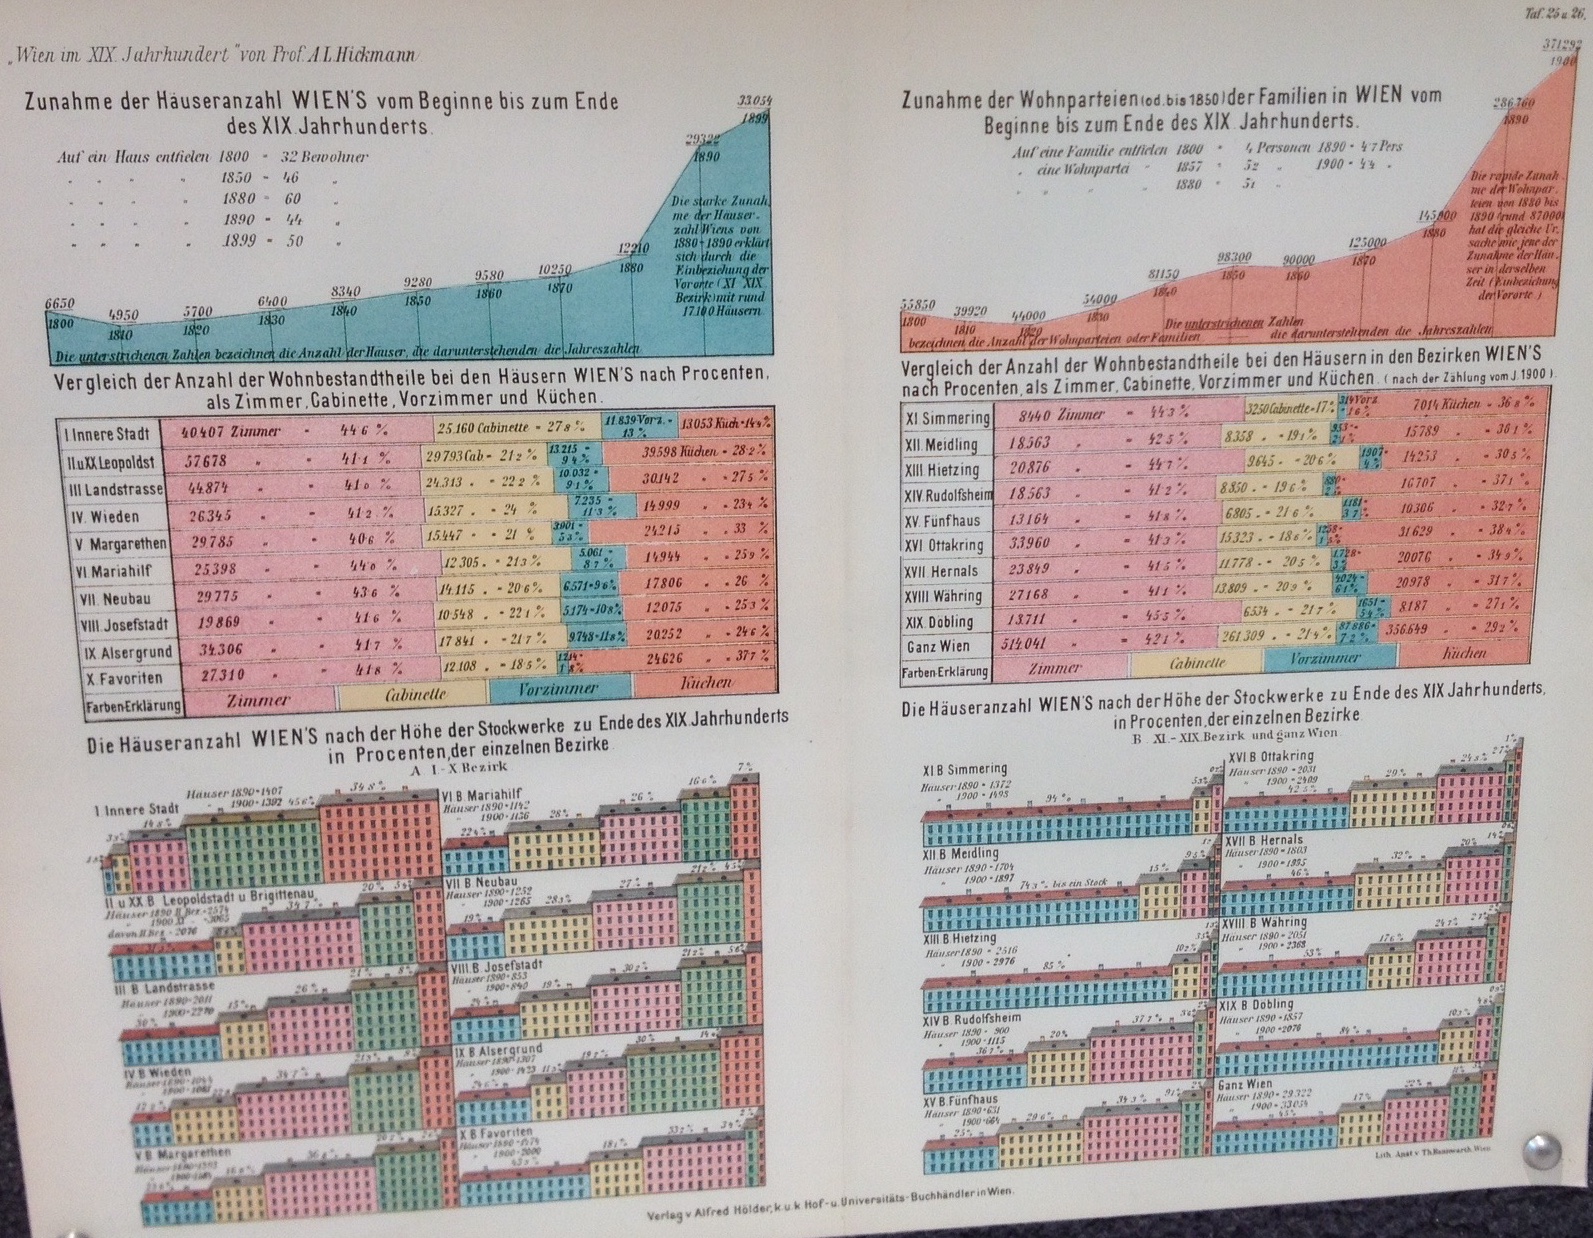
Urbanism in Vienna

This visualization features an early example of Isotype, showing the distribution of buildings by heights in each district of Vienna. Around 2/3 of the buildings in the inner city featured of 6 or 7 stories. While I am not sure what the charts on the first row represent, the second serie of chart represent the distributionof room types for each district of Vienna. The low percentage of kitchens in the inner town could be an indication of many large appartments featuring multiple rooms. Also the percentage of Vorzimmer (anteroom?) could be an indication of the relative walth od the inhabitants of each district.
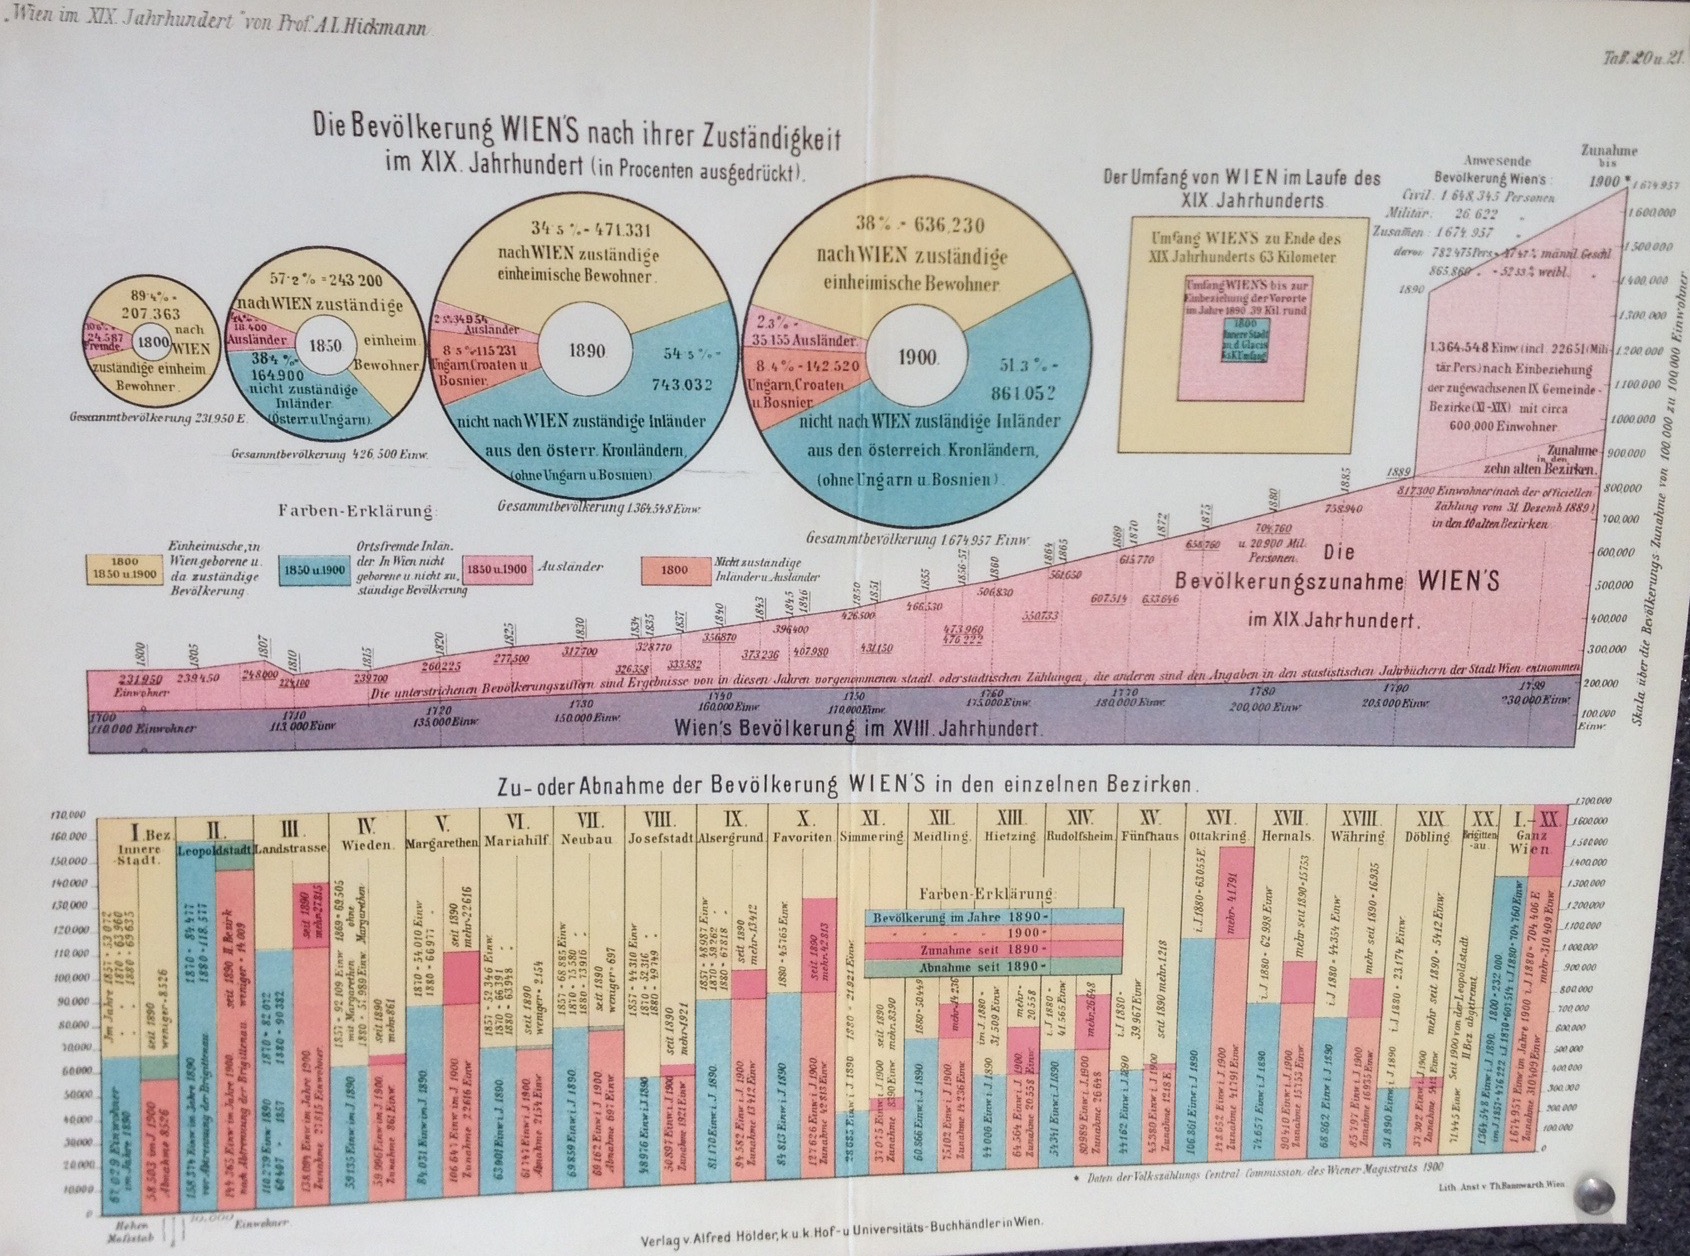
Popluation of Vienna

The first serie of donut charts shows the evolution of size and origin of population (from Vienna, from Austria, from other part of empire or outside). It shows a growth of Vienna driven primarily by immigration from within Austria. The concentric squares shows the extension of Vienna in the 19th century. The last bar chart shows the pouplation by district in 1890 and 1900 with a highlight of the decrease (green) or increase (red).