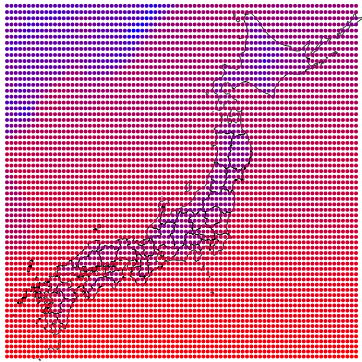
Japan temperature data
I tried to get temperature data for Japan, and the data source that I selected this time is from the National Center for Atmostpehric Research that produce 4 dailies estimations of global weather as well as forecast on a world grid of 0.25 degrees.
To download data you need to create an account on the Research Data Archive
If you query the whole earth for a long time range, you can easily end up having to download terabytes of data.
I just wanted to test the data with a few days for Japan only, and data was only ~50Mb.
Those are the parameteres I chose, being primarily interested in temperature data.
- Start date: 2015-11-06 00:00
- End date: 2015-11-18 21:00
- Parameter(s):
- Temperature
- Apparent temperature
- Wind speed (gust)
- Soil temperature
- Spatial subsetting (bounding box):
- Latitudes (top/bottom): 46 / 30
- Longitudes (left/right): 128 / 148
After waiting a couple of hours, you receive a download link to GRIB2 files.
I used grib2json to transform the files in usable json files (GRIB is a binary format)
grib2json --fs 103 --fv 2.0 --names --data grib2file > data.json
Be sure to use the parameter --data or there will be only headers and no data i the ouptu.
Use names to make the file human readable.
Data output is presented as an array of temperature data (in Kelvin) line by line in your selection.
Plotting the dataset on a map
First we define a projection for Japan:
var projection = d3.geo.mercator()
    .center([139, 35])
    .scale(1000)
    .translate([width / 2, height / 2]);
Then we plot the map using this topojson map of Japan.
var path = d3.geo.path()
  .projection(projection);
var features = topojson.feature(jpn, jpn.objects.japan).features;
svg.selectAll("path")
  .data(features)
  .enter()
  .append("path")
  .attr("stroke", "black")
  .attr("stroke-width", "1")
  .style('fill', 'none')
  .attr("d", path);
Now we preprocess the data to map the array to screen coordinates.
var mydata =  temperatures.map(function(d, i){
  var pos = projection([
    lo1 + dx * (i % nx),
    la1 + dy * parseInt(i / nx)
  ]);

  return {t: d, x: pos[0], y: pos[1]};
})
Finally data is plotted as circles with a a color scale.
 var color = d3.scale.linear()
  .domain(d3.extent(temperatures))
    .range(["blue", "red"]);
var tempCircles = svg.append('g').attr('class', 'temperatures');
tempCircles.selectAll('circle')
  .data(mydata)
  .enter()
    .append('circle')
    .attr('r', 2)
    .attr('cx', function(d) {return d.x; })
    .attr('cy', function(d) {return d.y; })
    .style('fill', function(d) {return color(d.t)});
You can see and play with the code and result here
We can see that at this time of the year, temperature above ocean is in general warmer than above land.