![]()
In this article, I will introduce a few notions of systems thinking as it relates to the design of dashboards or any UI based on gathered data.
Systems thinking
Are you familiar with Systems Thinking? If you are an engineer you probably have some familiarity with the fields of cybernetics or automatic control, and this can System Thinking can be perceived as an extension to soft systems such as social systems.
Are you familiar with Systems Thinking? If you are an engineer you probably have some familiarity with the fields of cybernetics or automatic control. Systems Thinking can be understood as an extension to soft systems such as social systems.
System Thinking is about understanding and modelling systems comprised of a number of elements or agents interacting with each other. The model enables the identification of loops controlling the stability and evolution of a system.. Loops can either be balancing (negative feedback) or reinforcing (positive feedback) . It is powerful as it enables the modelization of systems with more details and more flexibility than a simple cause-effect model.
Example: The fitness system
Let's see a simple system: human body reaction to physical training and the supercompensation effect. This should be familiar concept if you have read books like Starting Strength.
The idea is that training produces 2 opposite effects: exhaustion and compensation. The first increases the fitness level while the latter decreases it. Also, an increase fitness level allows for an increased training intensity. (a third effect, fitness decay over time is ignored here as a simplification)
This can be represented as the following causal loop diagram above, with R being the Reinforcement loop and B the feedBack loop.
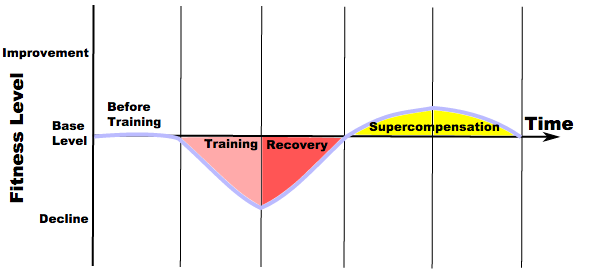
Luckily the compensation effect can be stronger than the exhaustion. Also, from a dynamic point view, it happens that the time constants of the fatigue effect is shorter than the one for the compensation effect. After training, your fitness level is first decreased, but then increased above the original level by the compensation. The result, when taking account and extra decay effect, is the chart below.
 source: wikipedia
A consequence is that successful training is strongly related to 2 factors:
- ensuring an increase in the training intensity to activate the reinforcement loop
- ensuring enough time for recovery so that new training occurs from an increased fitness level
Adding an activity tracker
Over the last years, activity trackers have been very popular. Let's see how they interact in the system above in the case of walking and steps counters.
In this particular case, the positive feedback loop is weak. Walking more makes it easier to walk, but the motivation aspect is largely ignored.
The success of the activity tracker lies in its capacity to increase the fitness level. To increase the fitness level, we need to reduce the effect of the balancing loop or stimulate the positive feedback loop.
What happens if we introduce a tracker? First, let's assume this tracker's UI (the 'dashboard') shows only the amount of steps taken or total distance walked.
![]()
This tracker is basically useless: it shows the amount of exercise taken, but doesn't prompt the user for action. It has no impact on the system. We will need to close the information loop to make it work.
![]()
Introducing a goal, which can be static or based on past performance will do the job. Showing a delta to the goal creates an incentive (the reward of achieving the goal) that stimulates the action of walking more.
We achieved to close the loop and bring a positive change by a simple tweak in the UI. We simply show a delta to a target instead of a raw measure.
Of course this is a simplified example. Motivation to walk more is not in a linear relation with the delta, and there are more effects to consider.
Finally, in order to continue to reinforce the feedback loop, we will need to make sure the goal is gradually increased.
Conclusion and takeaways
I hope this article will trigger new thoughts in your approach to designing UIs and dashboards!
Takeaways:
- A dashboard is a new information link in a system.
- Choose metrics that let that information link impact the system.