I had the opportuniy to work on a project using d3 and x3dom for a client 1 year ago, and wanted to share a bit my experience on mixing those 2 tools.
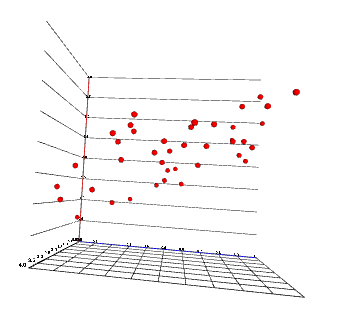
This is post is a collection of tips on how to get started. In this first part, we will see how to make the infamous 3d pie chart... Or in fact maybe not, and make a simple scatter like the one in the below. It can be accessed here.
Why 3d?
While 3d charts have a bad reputation due to the many abuses, I still think it could be interesting to play a bit more with 3d visualizations. I have seen some succesful examples in the past, in particular this New York Times visualization of the US government bonds yield curve. And with the upcoming wave of VR and AR, the navigation and manipulation of 3d visualization could become easier, making them more useful.
Why x3dom?
x3dom is an open source framework for rendering 3d graphics in a broswer. Its specifity is that it allows to declare the 3d scene using the DOM. The x3dom library then parses it and renders the scene in a canvas. Since it is using the DOM, it plays rather well with d3 and it feels a bit like adding a 3rd dimension to SVG.
Getting started: setting up x3dom
If you are not familiar at all with x3dom, I suggest you check the examples on the x3dom website.
The code for this first part is here.
First, we will need to include x3dom js and css files to our page as well as d3.js (use the version 4).
<!DOCTYPE html>
<head>
  <meta charset="utf-8">
  <script src="http://x3dom.org/download/1.7/x3dom.js"></script>
  <script src="//d3js.org/d3.v4.0.0-alpha.28.min.js"></script>
  <script src="d3-x3dom-axis.min.js"></script>
  <link rel="stylesheet" href="http://x3dom.org/download/1.7/x3dom.css" type="text/css" inline>
</head>
<body>
<script>/*Our script will go here*/</script>
</body>
I also included d3 (v4 in that case, but no major difference with v3 here), and d3-x3dom-axis that is a small plugin allowing to create axis easily, like d3-axis, and that you can find here
Then, we need to add a x3d node. That will be the DOM entry point for the whole x3dom scene definition and will be parsed by x3dom.
var width = 800, height = 600;
var x3d = d3.select("body").append("x3d")
  .attr("width", width + 'px')
  .attr("height", height +'px' );
At this point, you should notice that a canvas element has been added as a child of the x3d element.
Bonus: You will notice that if you render your scene this way, it tends to be quite aliased. To get some antialiasing, one solution is to force rendering at double size of the canvas. It is not perfect but does improve line edges.
d3.select('.x3dom-canvas')
    .attr("width", 2 * width)
    .attr("height", 2 *  height);
Note: You will notice that most of the time, x3dom is quite flexible in its parsing of attributes, accepting coma and space separated coordinates, dimensions followed by px or not. I am not aware of the best practice and am not doing recommendations here.
It is also possible to set up an initial viewpoint. It can be changed later programmaticaly or using the x3dom library interactions:
var view_pos = [80, 25, 80];
var fov = 0.8;
var view_or = [0, 1, 0, 0.8];
scene.append("viewpoint")
    .attr("position", view_pos.join(" "))
    .attr("orientation", view_or.join(" "))
    .attr("fieldOfView", fov);
The viewpoint defines a camera position, orientation and field of view. It can be tricky to set up properly
Adding content
To add some 3d content, we then need to add a scene.
var scene = x3d.append("scene");
It will contain the definition of all the 2d shapes.
Every 3d element will be define within a shape element. For example, to add a cube:
var cube = scene.append('shape');
cube.append('box');
This will create a 3d cube, with default size of [1, 1, 1]. However it won't be visible as no material was assigned to it, so it is still only ether.
Assigning a appearance can be done like that:
cube.append("appearance")
    .append("material")
    .attr("diffuseColor", 'red');
This assigns a material that diffuses a red color to the cube.
We create a convenience function that can be used any time we want to set a color to a shape:
var makeSolid =  function(selection, color) {
    selection.append("appearance")
        .append("material")
        .attr("diffuseColor", color || "black");
    return selection;
};
cube.call(makeSolid, 'red');
We can now see the box, and scroll to change the zoom or click and drag to change the viewpoint.
There are primitive shapes other than boxes. There is a good tool to discover and play with x3d primitives here.
Each primitive will be useful for different purposes:
- cylinders for axis and straight lines
- boxes for bars
- spheres for points in a scatter
- extrusion for multi-segment 'lines'
- IndexedFaceSet for surfaces (we will see that in the next tutorial) or more complex shapes.
Creating axes
Next we will create the axis. We can draw one using a cylinder shape. Note that cylinder are created by default along the Y axis and will need no be rotated to display X or Z axis.
scene.append('group')
   .attr('class', 'xAxis')
   .append('transform')
   .attr("rotation", [1, 1, 0, Math.PI].join(' '))
   .attr("class", "tickLine")
   .append("shape")
   .call(makeSolid, 'blue')
   .append("cylinder")
   .attr("radius", 0.05)
   .attr("height", 10);
group and transform are the element that take the role of g in SVG.
This would create a X axis representation. We would then need to add ticks, that could expand as a grid, either along the Y or Z axis. Since this is tedious to do, I made an utility to generate them (you can check it here, and I am pretty sure it can be improved).
For example, to generate an X axis with ticks along the Z axis generating a grid:
var x = d3.scaleLinear().range([0, 40]);
var y = d3.scaleLinear().domain([0, 4]).range([0, 40]);
var z = d3.scaleLinear().range([0, 40]);
var xAxis = d3_x3dom_axis.x3domAxis('x', 'z', x)
    .tickSize(z.range()[1] - z.range()[0])
scene.append('group')
    .attr('class', 'xAxis')
    .call(xAxis)
    .select('.domain').call(makeSolid, 'blue');
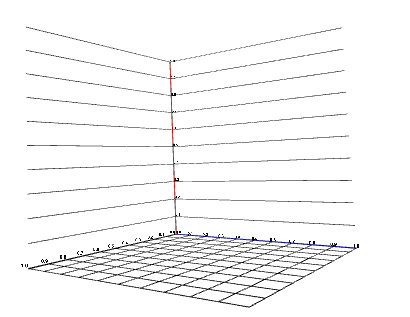
The picture below represent axes with ticks created with d3-x3dom-axis. The blue one is the X axis and the red one the Y axis. 2 Y axis have been created to create the tick line along both X and Z axis.
Adding points for a scatter
We will now make a 3d scatter.
Let's first generate some data
 var n = 40;
    var points = d3.range(n).map(function(d) {
    var p = {};
    p.x = Math.random();
    p.z = Math.random();
    p.y = 2 * p.x + p.z + Math.random();
    return p;
  })
That should create a set of points roughly aligned in a plane.
Display them will follow an usual d3 pattern. We will use the sphere as a primitive.
scene.selectAll('.point')
    .data(points)
    .enter()
    .append('transform')
    .attr('class', 'point')
    .attr('translation', function(d){
        return x(d.x) + ' ' + y(d.y) + ' ' + z(d.z);
    })
    .append('shape')
    .call(makeSolid, 'red')
    .append('sphere')
    .attr('radius', 0.5);
And that's it! You should get something similar to the image at the top of this page.
Final notes
We saw how to initialize an x3dom scene, create axis and make a scatter plot. Thanks for reading until here. You can check the next part covering the use of IndexedFaceSet
Do you want to learn how to create better dashboard and UIs for, in particular for IoT and Wearables? Pre-order the Elements of Dashboard Design book now for a special prelaunch price