I am finally back with a follow up for the d3.js + x3dom tutorial where we saw how to initalize an x3dom canvas, plot axes and make a scatter plot.
In this second part, I will cover how to make a Surface plot with IndexedFaceSet.
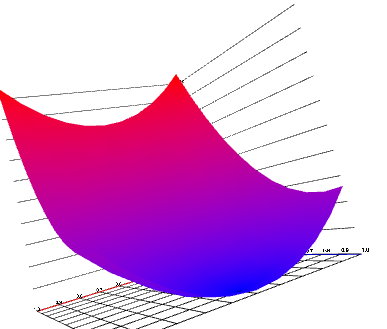
A surface plot with IndexedFaceSet
We will be working on a surface plots. They are very useful for visualizing a distribution of probability on a 2d space, or for visualizing cohorts. There is a good example by The New York Times of a yield curve.
The indexedFaceSet is a slightly complex x3dom node type that allows you to specify an array of points that belong to the surface in a coordinate node and a coordIndex attribute that specifies the faces to be drawn. Faces can be triangles, quadrilaterals of other polygons.
In our case, we will draw our surface plot using quads. You can find some examples of surface plots with other libraries such as matplotlib or plotly.
We will first draw it directly, then using d3-x3dom-shapes for convenience.
Initialize x3dom and axis
After putting code from the first part into initX3DomScene and drawAxes function, we end up initializing the scene as follow:
  var width = 800, height = 400;
  var scene = initX3DomScene('body', width, height);

  var x = d3.scaleLinear().range([0, 40]);
  var y = d3.scaleLinear().range([0, 40]);
  var z = d3.scaleLinear().range([0, 40]);
  drawAxes(scene, x, y, z);
The whole code is longer so you can refer to the block for details (in particular the point of view has been set carefully). You should now have the grid displayed.
Generating the surface
First, let's define the function to plot. Here we use a simple parabolic function.
  var cx = 0.3;
  var cy = 0.8;
  var f = function(vx, vy) {return (vx - cx)*(vx - cx) + (vy - cy)*(vy - cy);};
And now the data:
  var X = d3.range(0, 1.05, 0.1);
  var Y = d3.range(0, 1.05, 0.1);
  var nx = X.length, ny = Y.length;
  var data = d3.range(nx).map(function(i) {return d3.range(ny).map(
    function(j){
      return [X[i],Y[j], f(X[i], Y[j])];
    });})
We sample the XY plan to get nx different values for x axis and ny different values for the y axis.
The data is a 2d array listing the coordinates row by row.
Now we need to generate the coordinates of the points for the IndexedFaceSet coordinates node.
It consists in a string of the following format x0 y0 z0 x1 y1 z1 x2 y2 z2, where [xi, yi, zi] is the coordinates of the ith point. At that stage any order of point can be defined, but better use one that will be practical to refer to later. We can just flatten the data array, which will keep a definition row by row.
  var flattened = d3.merge(data);
  var coordinates = d3.merge(flattened).join(' ');

  var coordIndex = d3.merge(d3.range(ny - 1).map(function(j) {
    return d3.merge(d3.range(nx - 1).map(function(i) {
      var start = i + j * nx;
      return [start, start + nx, start + nx + 1, start + 1, start, -1];
    }));
  }));
For defining the surface, wer define each quad successively, row by row, as shown on the picture below.
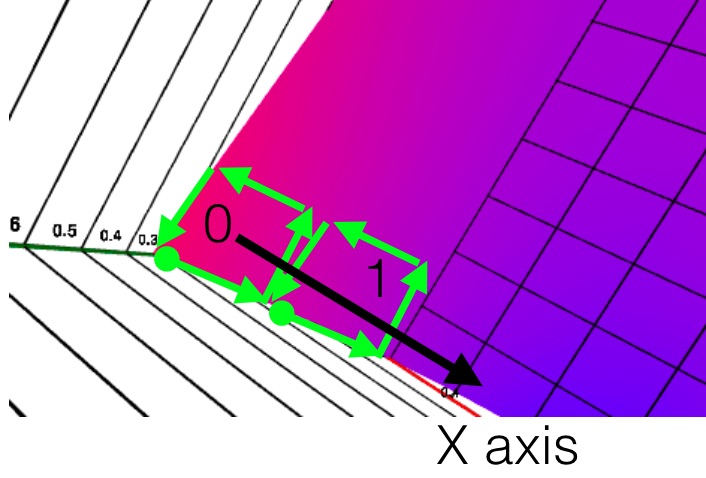
Each quad is defined by specifying the vertex indexes (points) successively and terminating with a -1. Be careful to slaways specify with the same winding order (here anti-clockwise) to avoid unexpected effects (we will talk more about it in a minute).
We can now display it:
  var surfacesData = [{
    points: coordinates,
    faces: coordIndex.join(' '),
  }]

  var surfaces = scene.selectAll('.surface')
    .data(surfacesData);
  surfaces
    .enter()
    .append('shape')
    .append('indexedfaceset')
    .attr('coordIndex', function(d) { return d.faces} )
    .append("coordinate")
    .attr('point', function(d){ return d.points;});
The bad surprised is that the surface plot is single faced and it is not visible for all directions when chaging the view.
Making the surface double faced
Our surface is single-sided because x3dom only fills one side, defined by the winding order of the face definition. We will need to specify the back face as well in order to get a double-sided surface.
  var coordIndexBack = d3.merge(d3.range(ny - 1).map(function(j) {
    return d3.merge(d3.range(nx - 1).map(function(i) {
      var start = i + j * nx;
      return [start, start + 1, start + nx + 1, start + nx, start, -1];
    }));
  }));
And our surface data is now:
  var surfacesData = [{
    points: coordinates,
    faces: coordIndex.concat(coordIndexBack).join(' '),
  }]
We now have a the surface we want.
Note: On a related topic, even though it does not apply here, when you apply a material to a shape, it is generally single faced. To make it 2-sided you can use Two sided Material.
Adding a color gradient
The plain white color make it difficult to see the shape, so we are going to add a color gradient based on the z value. For demonstration purpose we use a gradient from blue to red, but a grayscale gradientcan be enough to give a hint .
First, our color scale:
  var color =  d3.scaleLinear().domain(d3.extent(flattened, function(d) {return d[2];}))
    .range(['blue', 'red'])
    .interpolate(d3.interpolateLab);
This creates a gradient color scale on the domain of our z values.
X3dom has different way to specify colors, we will use the simplest one which associates a color to each vertex (the points in our coordinates definition). Also, we will need to to convert the colors to be provided as r0 b- g0 r1 g1 b1 with values between 0 and 1. Here we keep only 1 significant figure to avoid having too long definitions (easier for debug when you don't have dom elements of thousands of characters).
var colors = flattened.map(function(d) {
var col = d3.color(color(d[2]));
  return '' + Math.round(col.r/2.55)/100 +' ' + Math.round(col.g/2.55)/100 + ' ' + Math.round(col.b/2.55)/100;
});
And we add a color node to our surfaces:
d3.selectAll('indexedFaceSet')
  .append('color')
  .attr('color', function(d){return d.colors;});
Final surface plot with gradient
using d3-x3dom-shape
I started the d3-x3dom-shape library that ease out the creation of lines and surfaces with d3.js and x3dom. (at the moment only those, hopefully more as it evolves)
You can see see and fork the demo on blockbuilder.
In particular, it will take care of:
- specifying both sides
- formatting the colors and coordinates in a format suitable for x3dom
Starting with the same data, we only have to do:
  var surface = d3_x3dom_shape.surface()
    .x(function(d) {return x(d[0]);})
    .y(function(d) {return y(d[1]);})
    .z(function(d) {return z(d[2]);})
    .color(function(d) {
      return d3.color(color(d[2]));
        });


  var surfaces = scene.selectAll('.surface')
    .data([data]);
  surfaces
    .enter()
    .append('shape')
    .append('indexedfaceset')
    .attr('coordIndex', surface)
    .append("coordinate")
    .attr('point', surface.coordinates);

  d3.selectAll('indexedFaceSet')
    .append('color')
    .attr('color', surface.colors);
I chose to have an interface that generates the data for each required field independently rather than appending the whole DOM as I though it would be closer to the way we work with SVG usually. It also makes it easier to customize. What do you think?
Do you want to learn how to create better dashboard and UIs for, in particular for IoT and Wearables? Pre-order the Elements of Dashboard Design book now for a special prelaunch price